
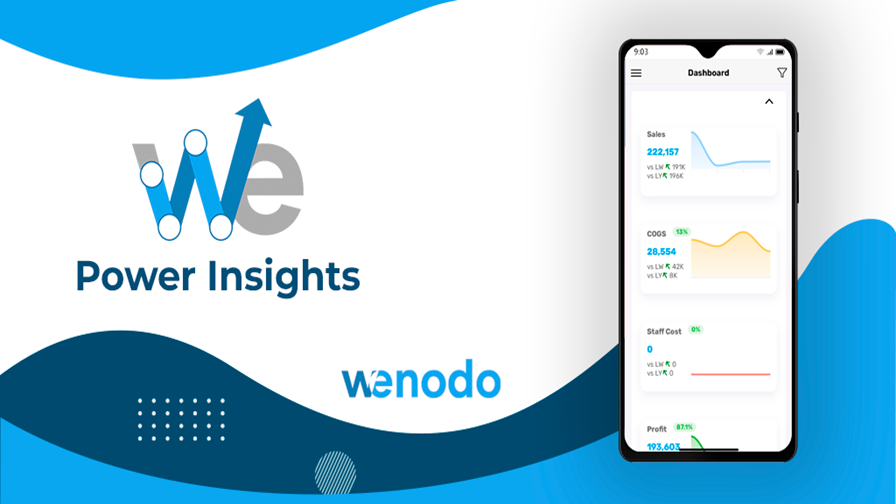
Wenodo is a Power Insight Dashboard that provides actionable insights for hospitality businesses. Key features include:
Ideal for:
Wenodo empowers hospitality businesses to make data-driven decisions, improve operational performance, and unlock their full potential through a seamless fusion of beauty, insight, and intuition.

AI data pulses for Slack & Teams that automate business intelligence and team alignment. Key features include:Automated data analysis: Get intelligent insights from your connected data sources directly in Slack.Team-wide collaboration: Foster data-driven discussions and retain knowledge within threads.Seamless integrations: Connect spreadsheets, databases, and business tools like Google Sheets and BigQuery.Ideal for:Teams without dedicated data analystsBusinesses seeking immediate data insightsRemote and hybrid workforcesAn always-on data analyst in Slack, ensuring no data insight is ever lost.

RedditHunter is a market research tool that helps businesses discover opportunities and understand customer needs by analyzing Reddit data. Key features include:Trend Analysis: Identify emerging trends and viral content patterns across Reddit.Market Research: Find new market opportunities and analyze existing markets within Reddit communities.Instant Scanning: Quickly scan thousands of Reddit posts, threads, and comments to extract valuable insights.Clarity at a Glance: Auto-organized insights, patterns, and top posts for fast action.Ideal for:Founders validating market assumptionsMarketers seeking customer insightsBusinesses looking for growth opportunitiesRedditHunter provides instant clarity on market sentiment by scanning Reddit threads, eliminating manual digging and guesswork.

SEOWRAP is a free SEO analytics tool that transforms your Google Search Console data into engaging, shareable stories. Key features include:Overview Story: Provides total clicks, impressions, and growth metrics.Top Queries Story: Highlights your best-performing search terms.Champion Pages Story: Showcases top pages with detailed stats.Ideal for:SEO professionalsWebsite ownersDigital marketersSEOWRAP offers a unique, visually appealing way to understand and share your SEO performance, making complex data accessible and engaging.

IntroductionOpenDataHive is an open data platform designed to provide easy access to public datasets. It structures data in a hexagonal hive format for intuitive exploration. Key features include:Data Discovery: Easily find relevant datasets using the hexagonal hive structure.API Access: Access data programmatically via APIs in JSON, CSV, and XML formats.Dataset Variety: Explore a wide range of public datasets across various domains.Ideal for:Data scientistsResearchersDevelopersOpenDataHive simplifies the process of finding and utilizing open data, making it more accessible and efficient for data-driven projects.

Superway is an innovative AI-driven Trend Research Oracle designed to empower businesses with advanced trend analysis. By harnessing the power of artificial intelligence, Superway provides valuable insights that help organizations navigate market dynamics and elevate their strategic decisions. Discover how Superway can transform your approach to trend analysis and drive your business success.FEATURESTrend Analysis: helps you understand market trends AI Insights: gives you smart suggestions based on data Market Dynamics: shows how the market is changing Business Strategy: assists in making better business choices Data Visualization: presents info in easy-to-read charts Competitive Analysis: compares your business with others Forecasting Trends: predicts future trends based on data

Make Graph is a free online graph maker that allows users to create a variety of charts and graphs. Key features include:Multiple Chart Types: Offers a wide selection of chart types, including bar, line, pie, scatter, radar, funnel, heat maps, word clouds, and maps.Ready-to-Use Templates: Provides professionally designed chart templates for common use cases to get started quickly.No Sign-Ups or Downloads: Users can create beautiful charts instantly without needing to register or install any software.Data Visualization: Transforms data into visually appealing and informative charts.Ideal for:Students needing to visualize data for school projectsProfessionals creating presentations and reportsResearchers analyzing and presenting dataMake Graph offers a simple and accessible way to create professional-looking charts and graphs online for free, making data visualization easy for everyone.