Introduction
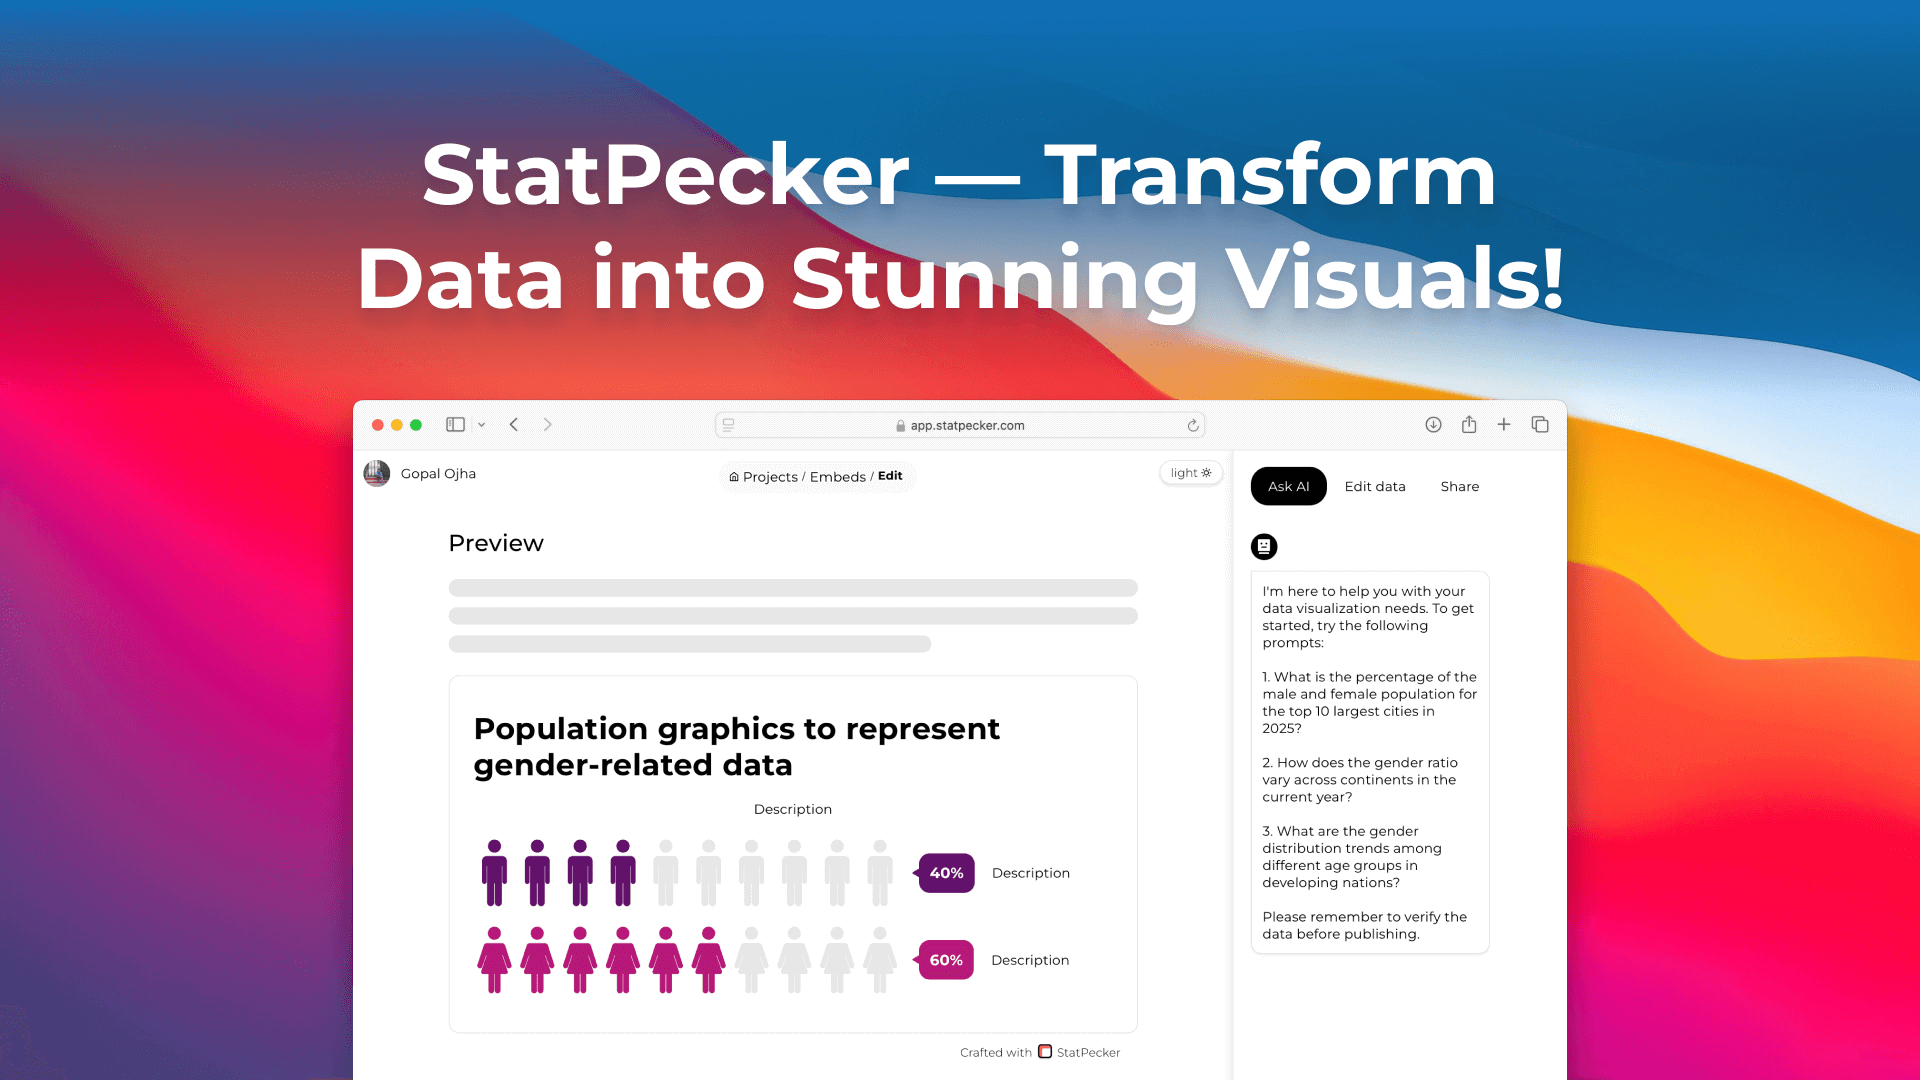
StatPecker is an AI-powered data visualization tool that helps users extract insights from data and create stunning infographics. Key features include:
Ideal for:
StatPecker offers a no-code solution for data visualization, making it accessible to users of all skill levels. It simplifies the process of turning raw data into compelling visuals, saving time and effort.
IntroductionOpenDataHive is an open data platform designed to provide easy access to public datasets. It structures data in a hexagonal hive format for intuitive exploration. Key features include:Data Discovery: Easily find relevant datasets using the hexagonal hive structure.API Access: Access data programmatically via APIs in JSON, CSV, and XML formats.Dataset Variety: Explore a wide range of public datasets across various domains.Ideal for:Data scientistsResearchersDevelopersOpenDataHive simplifies the process of finding and utilizing open data, making it more accessible and efficient for data-driven projects.
🚀 DatastripesYour no-code, in-browser data engine: explore, analyze, and explain data in minutes.Datastripes is a no-backend, browser-native data engine with over 300+ drag-and-drop nodes, AI-powered insights, and even narrated dashboards, all designed to help you explore, transform, and visualize data instantly, without setup or code.Whether you're a business analyst, data scientist, or marketing professional, Datastripes gives you the tools to build powerful data workflows, directly in your browser.🔑 Key FeaturesFlow-Based AnalyticsBuild custom analytics pipelines visually. Drag, drop, and connect nodes to manipulate data your way; no SQL required.One-Click TransformationsClean and reshape data in seconds with intuitive actions, filters, and joins.AI-Powered Analysis & NarrationGet insights and explanations powered by local AI models, including auto-generated summaries and narrated dashboards.Zero SetupEverything runs in your browser. No backend, no installs, no accounts. Just open and start analyzing.🎯 Built ForBusiness AnalystsData ScientistsMarketing & Ops TeamsProduct ManagersNo-code Builders
IntroductionZapDigits is a no-code business intelligence platform that provides instant, beautiful dashboards for your product, revenue, and growth. Key features include:Connect Data Sources: Integrates with Stripe, Supabase, GitHub, Jira, Google Analytics, and more.Visualise Data: Transforms raw data into clear and insightful dashboards without writing queries.Simple Setup: Offers a user-friendly experience with no complicated setup or bloated features.Ideal for:Startups looking for quick insights into their key metrics.Entrepreneurs who need to track business performance without coding.Teams working with multiple apps and juggling big numbers.ZapDigits simplifies business intelligence, allowing you to connect, visualize, and grow with clarity.
tldr: GitHub’s built-in repo analytics sucks, so I built a better oneAs a maintainer of a few open-source projects, I’ve always wanted to better understand the traffic sources and trends for my repos. Unfortunately, GitHub’s built-in analytics only show limited data from the past 14 days, which doesn’t provide much insight.That’s why I built Repohistory, a better GitHub repo analytics platform. It automatically fetches and stores your traffic data every day, so you’re no longer limited to just 14 days. The dashboard shows you:Daily star growthTotal views & clones over timeTop referral websitesMost-viewed pages in your repoSo if you have any public repos on GitHub, Repohistory can give you a much clearer picture of your traffic trends!
IntroductionProduct Analytics Tools Directory is a curated resource that helps users find and compare the best product analytics tools. Key features include:Comprehensive Directory: A wide selection of product analytics tools.Detailed Comparisons: Side-by-side comparisons to evaluate solutions.Filtering Options: Find tools based on specific features like event tracking, session replay, and more.Ideal for:Product managersUX designersData analystsThis directory simplifies the process of selecting the right product analytics solution by providing a centralized hub for discovery and comparison.
Maybe Finance is an all-in-one personal finance platform designed to help users track, optimize, grow, and manage their money. Key features include:Account Aggregation: Connect to over 10,000 institutions to automatically track bank accounts, stocks, crypto, and other assets.Manual Entry & CSV Import: Add accounts manually or import transaction data via CSV for comprehensive tracking.Transaction Management: Create, edit, categorize, and filter transactions with custom rules and tags.Ideal for:Individuals seeking a holistic view of their finances.Users who want to track assets across multiple institutions.Those looking for flexible transaction management tools.Maybe Finance offers a user-friendly interface and powerful features to simplify personal finance management, whether you prefer automated linking or manual control.
Reach thousands of makers and founders