
Introduction
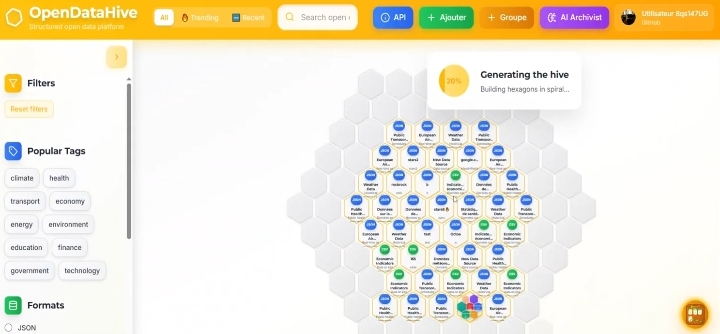
OpenDataHive is an open data platform designed to provide easy access to public datasets. It structures data in a hexagonal hive format for intuitive exploration. Key features include:
Ideal for:
OpenDataHive simplifies the process of finding and utilizing open data, making it more accessible and efficient for data-driven projects.
Reach thousands of makers and founders

Zenblog is a simple, headless blogging CMS designed for developers. Key features include:Notion-style Editor: A clean and intuitive writing experience.Hosted Media: Easy image and video uploads.Type-Safe API Client: Streamlines integration with your frontend.Developer-First Approach: Type-safe SDK, REST API, framework-friendly.Ideal for:Developers seeking a quick and easy blogging solution.Teams needing a headless CMS with a simple API.Bloggers who value a clean writing environment.Zenblog offers a fast and straightforward way to start blogging, eliminating the need for complex configurations and providing a seamless developer experience.

Make Graph is a free online graph maker that allows users to create a variety of charts and graphs. Key features include:Multiple Chart Types: Offers a wide selection of chart types, including bar, line, pie, scatter, radar, funnel, heat maps, word clouds, and maps.Ready-to-Use Templates: Provides professionally designed chart templates for common use cases to get started quickly.No Sign-Ups or Downloads: Users can create beautiful charts instantly without needing to register or install any software.Data Visualization: Transforms data into visually appealing and informative charts.Ideal for:Students needing to visualize data for school projectsProfessionals creating presentations and reportsResearchers analyzing and presenting dataMake Graph offers a simple and accessible way to create professional-looking charts and graphs online for free, making data visualization easy for everyone.

🚀 DatastripesYour no-code, in-browser data engine: explore, analyze, and explain data in minutes.Datastripes is a no-backend, browser-native data engine with over 300+ drag-and-drop nodes, AI-powered insights, and even narrated dashboards, all designed to help you explore, transform, and visualize data instantly, without setup or code.Whether you're a business analyst, data scientist, or marketing professional, Datastripes gives you the tools to build powerful data workflows, directly in your browser.🔑 Key FeaturesFlow-Based AnalyticsBuild custom analytics pipelines visually. Drag, drop, and connect nodes to manipulate data your way; no SQL required.One-Click TransformationsClean and reshape data in seconds with intuitive actions, filters, and joins.AI-Powered Analysis & NarrationGet insights and explanations powered by local AI models, including auto-generated summaries and narrated dashboards.Zero SetupEverything runs in your browser. No backend, no installs, no accounts. Just open and start analyzing.🎯 Built ForBusiness AnalystsData ScientistsMarketing & Ops TeamsProduct ManagersNo-code Builders

IntroductionZapDigits is a no-code business intelligence platform that provides instant, beautiful dashboards for your product, revenue, and growth. Key features include:Connect Data Sources: Integrates with Stripe, Supabase, GitHub, Jira, Google Analytics, and more.Visualise Data: Transforms raw data into clear and insightful dashboards without writing queries.Simple Setup: Offers a user-friendly experience with no complicated setup or bloated features.Ideal for:Startups looking for quick insights into their key metrics.Entrepreneurs who need to track business performance without coding.Teams working with multiple apps and juggling big numbers.ZapDigits simplifies business intelligence, allowing you to connect, visualize, and grow with clarity.

tldr: GitHub’s built-in repo analytics sucks, so I built a better oneAs a maintainer of a few open-source projects, I’ve always wanted to better understand the traffic sources and trends for my repos. Unfortunately, GitHub’s built-in analytics only show limited data from the past 14 days, which doesn’t provide much insight.That’s why I built Repohistory, a better GitHub repo analytics platform. It automatically fetches and stores your traffic data every day, so you’re no longer limited to just 14 days. The dashboard shows you:Daily star growthTotal views & clones over timeTop referral websitesMost-viewed pages in your repoSo if you have any public repos on GitHub, Repohistory can give you a much clearer picture of your traffic trends!

Zero MCP Skill Required - Just enter the MCP server description and get the usable MCP server configuration within seconds.MCP Explorer is your gateway to exploring the Model Context Protocol. Discover MCP tools, resources, and insights to enhance your AI applications.MCP Explorer is a comprehensive platform that simplifies the process of exploring and utilizing MCP servers, catering to a wide range of users from beginners to professionals looking to enhance your AI applications.Key Features:AI-Powered Server Creation: Create MCP servers with just one click using AI, no technical skills required.MCP Server Directory: Access a vast collection of MCP servers for various AI applications.Revenue Sharing: Submit your own MCP servers and set revenue-sharing ratios with the platform.Service Grouping: Organize frequently used MCP servers into groups for easier access.User-Friendly Interface: Intuitive design makes it easy for both beginners and professionals to navigate.Target Users:AI Developers: Enhance AI applications with ready-to-use MCP servers.Entrepreneurs: Quickly test and deploy AI business concepts.Technical Directors: Manage and debug MCP services efficiently.Unique Selling Points:One-Click MCP Creation: Simplifies the process of setting up MCP servers.Comprehensive Support: Includes features like service grouping and revenue sharing, making it a versatile tool for both individual and enterprise use.