
Make Graph is a free online graph maker that allows users to create a variety of charts and graphs. Key features include:
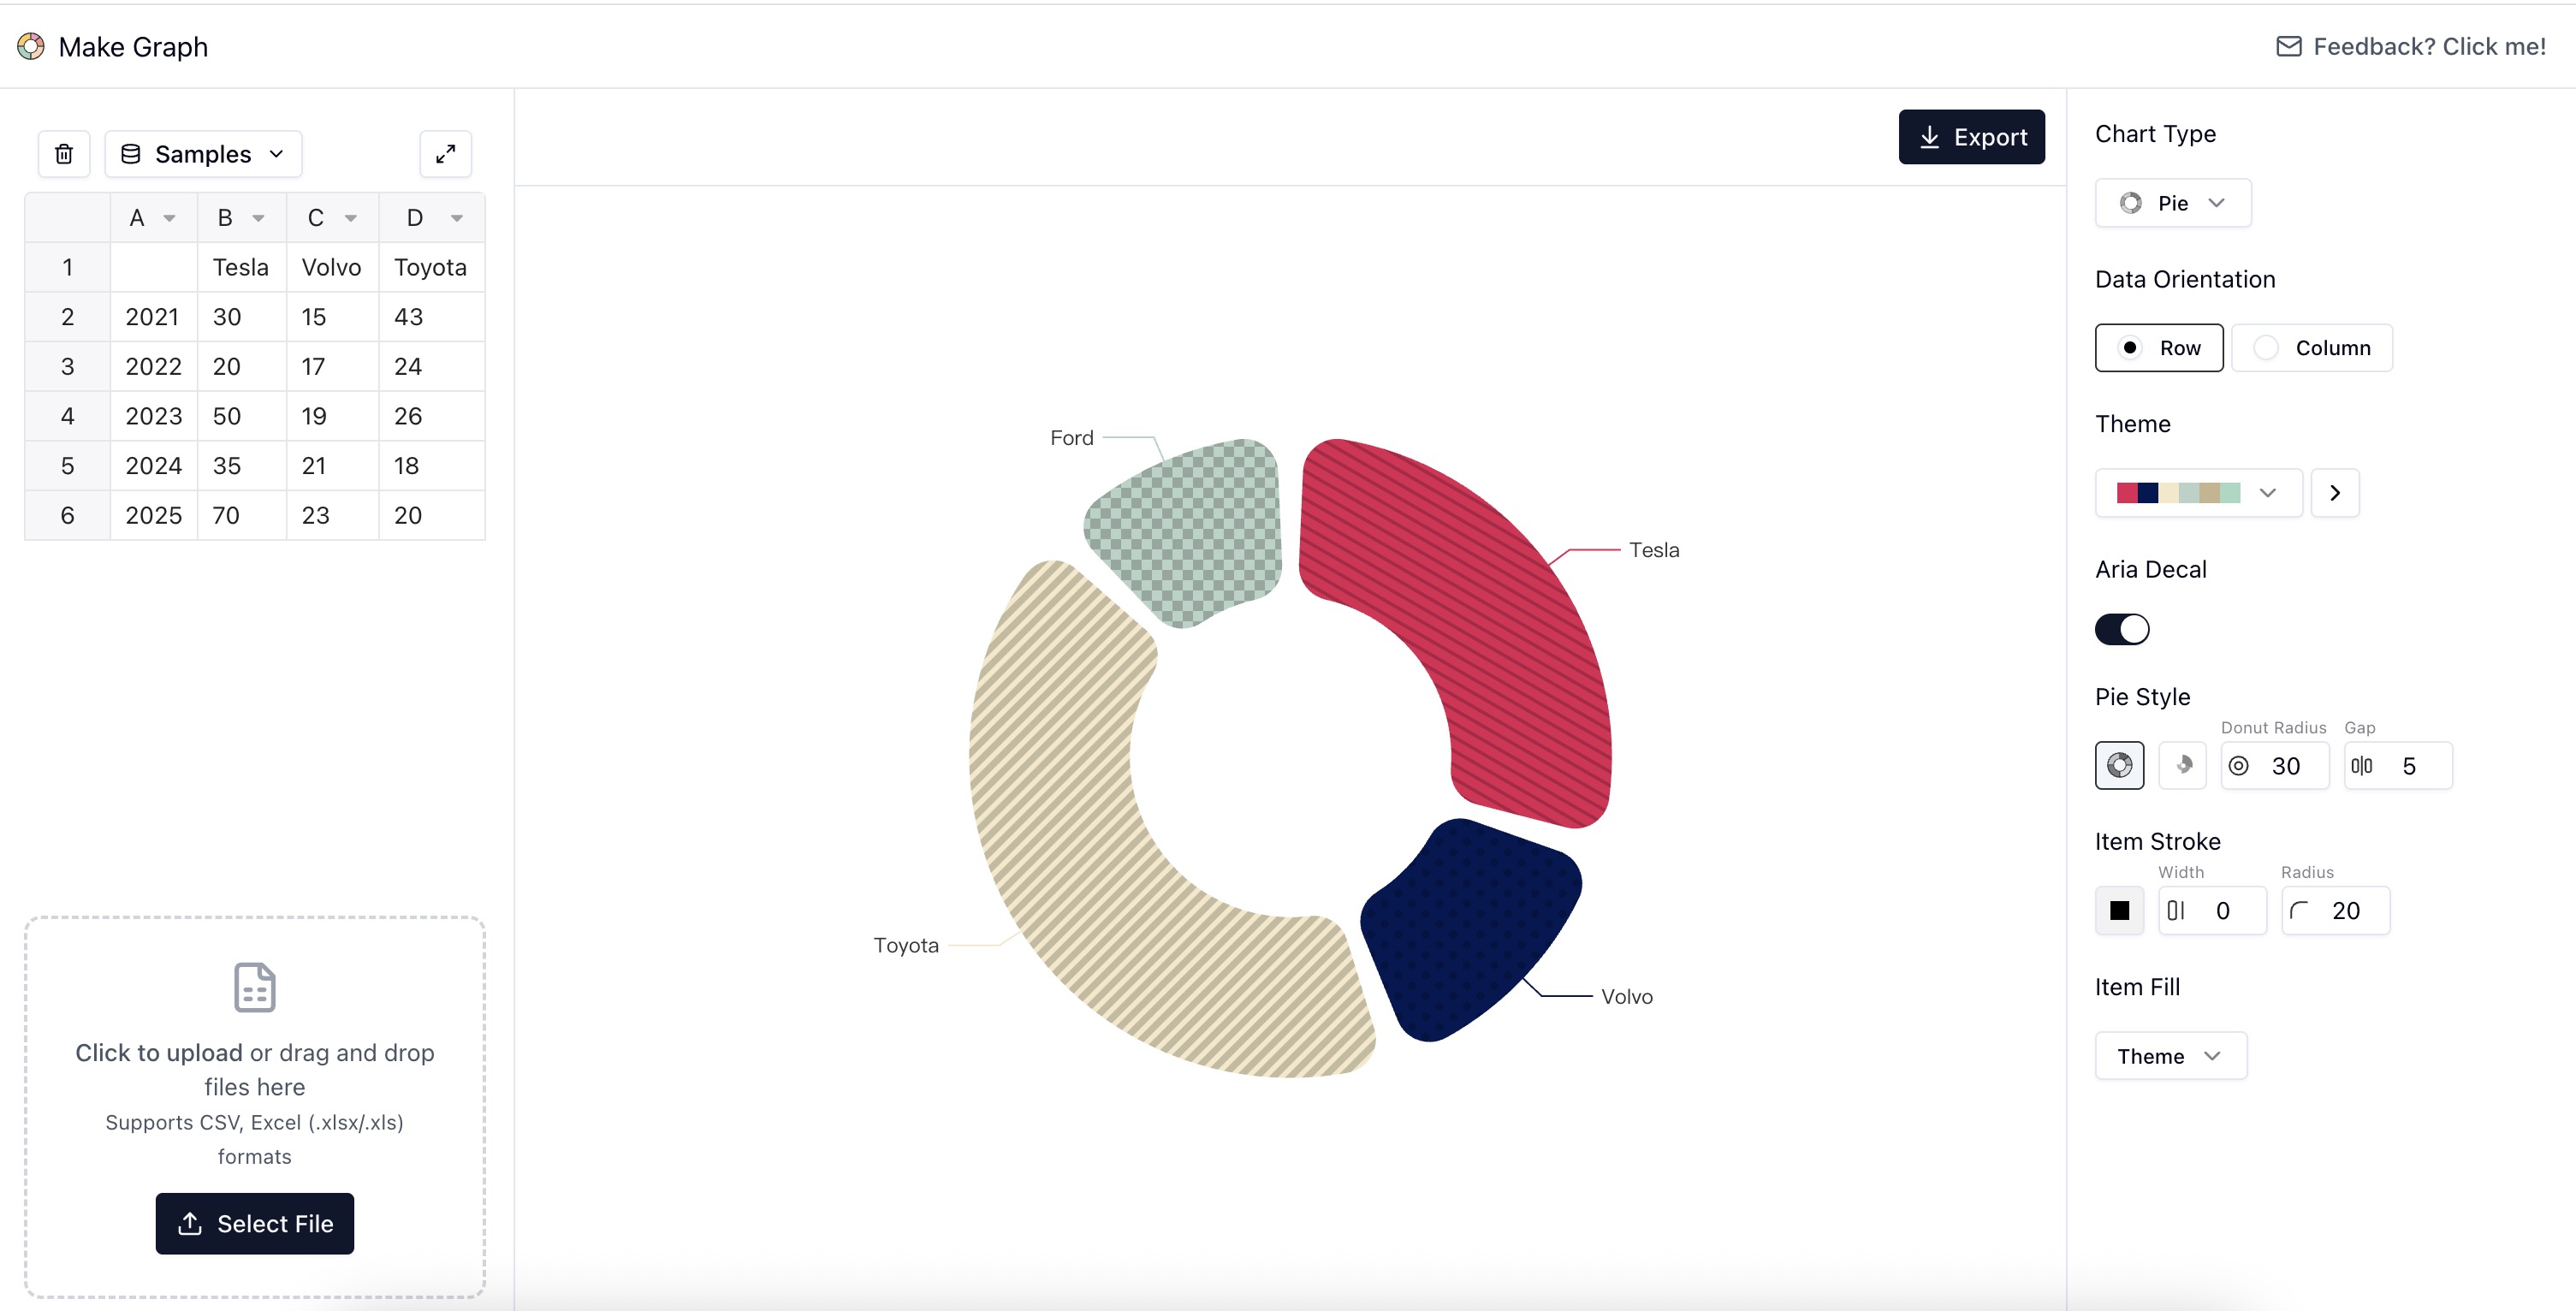
Ideal for:
Make Graph offers a simple and accessible way to create professional-looking charts and graphs online for free, making data visualization easy for everyone.

IntroductionOpenDataHive is an open data platform designed to provide easy access to public datasets. It structures data in a hexagonal hive format for intuitive exploration. Key features include:Data Discovery: Easily find relevant datasets using the hexagonal hive structure.API Access: Access data programmatically via APIs in JSON, CSV, and XML formats.Dataset Variety: Explore a wide range of public datasets across various domains.Ideal for:Data scientistsResearchersDevelopersOpenDataHive simplifies the process of finding and utilizing open data, making it more accessible and efficient for data-driven projects.

🚀 DatastripesYour no-code, in-browser data engine: explore, analyze, and explain data in minutes.Datastripes is a no-backend, browser-native data engine with over 300+ drag-and-drop nodes, AI-powered insights, and even narrated dashboards, all designed to help you explore, transform, and visualize data instantly, without setup or code.Whether you're a business analyst, data scientist, or marketing professional, Datastripes gives you the tools to build powerful data workflows, directly in your browser.🔑 Key FeaturesFlow-Based AnalyticsBuild custom analytics pipelines visually. Drag, drop, and connect nodes to manipulate data your way; no SQL required.One-Click TransformationsClean and reshape data in seconds with intuitive actions, filters, and joins.AI-Powered Analysis & NarrationGet insights and explanations powered by local AI models, including auto-generated summaries and narrated dashboards.Zero SetupEverything runs in your browser. No backend, no installs, no accounts. Just open and start analyzing.🎯 Built ForBusiness AnalystsData ScientistsMarketing & Ops TeamsProduct ManagersNo-code Builders

IntroductionVibe Musicing is an AI music generator that allows users to create songs with AI-generated music, lyrics, and beats. Key features include:AI Music Generation: Instantly generate music in various styles.AI Lyrics Generation: Create lyrics for your songs with AI.Customization Options: Fine-tune the style and title of your music.Music Gallery: Explore AI-generated music across multiple genres.Ideal for:Musicians seeking inspirationContent creators needing background musicAnyone interested in exploring AI music generationVibe Musicing offers a free and easy-to-use platform for creating unique AI-generated music, making it accessible to both beginners and experienced musicians.

IntroductionZapDigits is a no-code business intelligence platform that provides instant, beautiful dashboards for your product, revenue, and growth. Key features include:Connect Data Sources: Integrates with Stripe, Supabase, GitHub, Jira, Google Analytics, and more.Visualise Data: Transforms raw data into clear and insightful dashboards without writing queries.Simple Setup: Offers a user-friendly experience with no complicated setup or bloated features.Ideal for:Startups looking for quick insights into their key metrics.Entrepreneurs who need to track business performance without coding.Teams working with multiple apps and juggling big numbers.ZapDigits simplifies business intelligence, allowing you to connect, visualize, and grow with clarity.

tldr: GitHub’s built-in repo analytics sucks, so I built a better oneAs a maintainer of a few open-source projects, I’ve always wanted to better understand the traffic sources and trends for my repos. Unfortunately, GitHub’s built-in analytics only show limited data from the past 14 days, which doesn’t provide much insight.That’s why I built Repohistory, a better GitHub repo analytics platform. It automatically fetches and stores your traffic data every day, so you’re no longer limited to just 14 days. The dashboard shows you:Daily star growthTotal views & clones over timeTop referral websitesMost-viewed pages in your repoSo if you have any public repos on GitHub, Repohistory can give you a much clearer picture of your traffic trends!

IntroductionStatPecker is an AI-powered data visualization tool that helps users extract insights from data and create stunning infographics. Key features include:Ask Your Query: Get instant insights from validated sources using AI by simply asking questions.Publish & Embed: Make visuals interactive and seamlessly integrate them into blogs, articles, and websites.Upload & Analyze CSVs: Extract key insights from local CSV files without the hassle of spreadsheets.Download & Use Anywhere: Export infographics as images for reports, presentations, and more.Ideal for:Marketers looking to create engaging contentBusiness analysts needing to visualize data trendsContent creators seeking to enhance their storytellingStatPecker offers a no-code solution for data visualization, making it accessible to users of all skill levels. It simplifies the process of turning raw data into compelling visuals, saving time and effort.

Build Trust with Verified DR